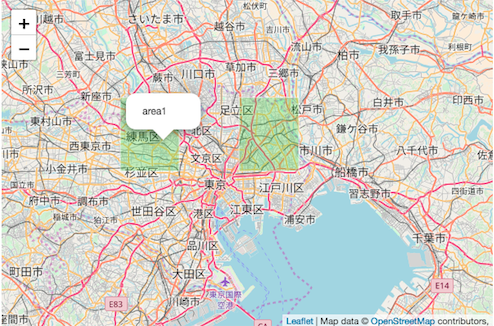
プラグイン(Rrose)を使用して、地図のある領域にマウスオーバーした際に、ポップアップメッセージを表示したいと思います。
【Rroseを適用した地図】
緑色の領域にマウスカーソルを合わせるとポップアップが表示されます。

Demoはこちらです。
目次
1.全体のコード
|
1 2 3 4 5 6 7 8 9 10 11 12 13 14 15 16 17 18 19 20 21 22 23 24 25 26 27 28 29 30 31 32 33 34 35 36 37 38 39 40 41 42 43 44 45 46 47 |
<!DOCTYPE html> <html> <head> <title>Leaflet Plugin Rrose</title> <meta charset="utf-8"> <meta name="viewport" content="width=device-width, initial-scale=1.0"> <link rel="stylesheet" href="https://unpkg.com/leaflet@1.3.1/dist/leaflet.css" integrity="sha512-Rksm5RenBEKSKFjgI3a41vrjkw4EVPlJ3+OiI65vTjIdo9brlAacEuKOiQ5OFh7cOI1bkDwLqdLw3Zg0cRJAAQ==" crossorigin=""> <script src="https://unpkg.com/leaflet@1.3.1/dist/leaflet.js" integrity="sha512-/Nsx9X4HebavoBvEBuyp3I7od5tA0UzAxs+j83KgC8PU0kgB4XiK4Lfe4y4cgBtaRJQEIFCW+oC506aPT2L1zw==" crossorigin=""></script> <!-- plugin --> <script src="js/map_data.js"></script> <script src="js/leaflet.rrose-src.js"></script> <link rel="stylesheet" href="css/leaflet.rrose.css" /> <!-- plugin --> <style type="text/css"> <!-- #mapid { height: 400px; width: 600px} --> </style> </head> <body> <div id="mapid"></div> <script> var map = L.map('mapid').setView([35.7102, 139.8132], 10); L.tileLayer('http://{s}.tile.osm.org/{z}/{x}/{y}.png', { maxZoom: 18, attribution: 'Map data © <a href="http://openstreetmap.org">OpenStreetMap</a> contributors, ' }).addTo(map); var escalator_geoj = new L.GeoJSON( graticule, { style: function(feature){ return feature.properties.style }, onEachFeature: function(feature,layer){ layer.on('mouseover', function(e){ var hover_bubble = new L.Popup({ offset: new L.Point(0,-5), closeButton: false, autoPan: true }) .setContent(feature.properties.name) .setLatLng(e.latlng) .openOn(map); }); layer.on('mouseout', function(e){ map.closePopup() }); } }).addTo(map); </script> </body> </html> |
2.解説
地図を描画するまでの解説は、leaflet入門1に記載しています。
2−1.プラグインの読み込み
|
1 2 3 |
<script src="js/map_data.js"></script> <script src="js/leaflet.rrose-src.js"></script> <link rel="stylesheet" href="css/leaflet.rrose.css" /> |
Rroseを使用するには、 「leaflet.rrose-src.js」と「leaflet.rrose.css」を読み込む必要があります。
各ソースは以下のサイトで配布されています。
また、プラグインとは別にマウスオーバーで処理を行いたい領域を定義したデータ(GeoJSON)を読み込んでいます。
2−2.表示データの準備
表示データは、GeoJSONで定義します。今回使用するデータの一部(緑色の領域)は以下の定義となります。
|
1 2 3 4 5 6 7 8 9 10 11 12 13 14 15 16 17 18 19 20 21 22 23 24 25 26 27 28 29 30 |
graticule = { "type": "FeatureCollection", "features": [ { "type": "Feature", "properties": { "id": "1", "name": "area1", "style": { "fillColor": "#74ce46", // 塗りつぶし "fillOpacity": 0.3, // 塗りつぶしの透明度 "color": "#fff", // 線のいろ "weight": 1, // 線の太さ "opacity": 0.7 // 線の透明度 } }, "geometry": { "type": "Polygon", "coordinates": [ [ [139.6, 35.7], [139.7, 35.7], [139.7, 35.8], [139.6, 35.8] ] ] } } ] } |
properties
id:一意となる識別子を定義します。
name:今回はポップアップに表示する文字列を定義します。
style:領域のスタイルを定義します。
geometry
type:描画する図形を指定します。囲われた領域を定義するので、「Polygon」を指定しています。
coordinates:図形の各頂点の経度・緯度を定義します。
2−3.GeoJSONデータ読み込み・イベントの設定
step2で定義したGeoJSONを読み込み、イベント(mouseover)の設定を行います。
|
1 2 3 4 5 6 7 8 9 10 11 12 |
var escalator_geoj = new L.GeoJSON( graticule, { style: function(feature){ return feature.properties.style }, onEachFeature: function(feature,layer){ layer.on('mouseover', function(e){ var hover_bubble = new L.Popup({ offset: new L.Point(0,-5), closeButton: false, autoPan: true }) .setContent(feature.properties.name) .setLatLng(e.latlng) .openOn(map); }); layer.on('mouseout', function(e){ map.closePopup() }); } }).addTo(map) |
new L.GeoJSON( graticule
graticule変数に格納されているGeoJSONデータを読み込みます。
onEachFeature: function(feature,layer){
GeoJSONデータの features配列の各データごとに イベント(mouseover)の設定を行なっています。
Rroseを使うと地図に各領域を定義し、領域ごとに処理を実装することができました。
ご興味があるかは、GitHub-Rroseもご参照いただければと思います。