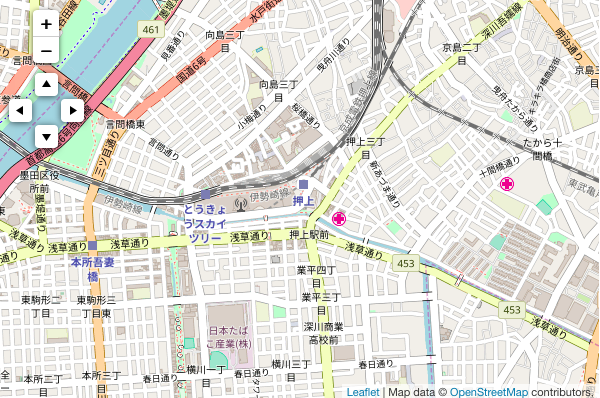
Leafletのプラグイン「Pancontrol」使用して、地図を上下左右に動かすコントローラーを追加することができます。
実装すると以下のようになります。

+ーのズームコントローラーの下にあるコントローラーが、今回追加するものです。
Demoはこちらです。
目次
1.全体のコード
|
1 2 3 4 5 6 7 8 9 10 11 12 13 14 15 16 17 18 19 20 21 22 23 24 25 26 27 28 29 30 31 32 33 34 35 36 37 38 39 |
<!DOCTYPE html> <html> <head> <title>Leaflet Plugin Pancontrol</title> <meta charset="utf-8"> <meta name="viewport" content="width=device-width, initial-scale=1.0"> <link rel="stylesheet" href="https://unpkg.com/leaflet@1.3.1/dist/leaflet.css" integrity="sha512-Rksm5RenBEKSKFjgI3a41vrjkw4EVPlJ3+OiI65vTjIdo9brlAacEuKOiQ5OFh7cOI1bkDwLqdLw3Zg0cRJAAQ==" crossorigin=""> <script src="https://unpkg.com/leaflet@1.3.1/dist/leaflet.js" integrity="sha512-/Nsx9X4HebavoBvEBuyp3I7od5tA0UzAxs+j83KgC8PU0kgB4XiK4Lfe4y4cgBtaRJQEIFCW+oC506aPT2L1zw==" crossorigin=""></script> <!-- plugin --> <link rel="stylesheet" href="css/L.Control.Pan.css" /> <script src="js/L.Control.Pan.js"></script> <!-- plugin --> <style type="text/css"> <!-- #mapid { height: 400px; width: 600px} --> </style> </head> <body> <div id="mapid"></div> <script> // Mapの基本設定 var map = L.map('mapid',{ center: [35.7102, 139.8132], zoom: 15, minZoom: 10, maxZoom: 16 }) L.tileLayer('http://{s}.tile.osm.org/{z}/{x}/{y}.png', { attribution: 'Map data © <a href="http://openstreetmap.org">OpenStreetMap</a> contributors, ' }).addTo(map); L.control.pan().addTo(map); </script> </body> </html> |
2.解説
地図を描画するまでの解説は、leaflet入門1に記載しています。
2−1.ファイルの配置
Pancontrol の本体は GitHubからダウンロードできます。
GitHubから取得したcss・jsファイルを以下のように配置します。
index.html
css/L.Control.Pan.css
css/images/pan-up.png
css/images/pan-right.png
css/images/pan-left.png
css/images/pan-down.png
js/L.Control.Pan.js
2−2.プラグインの読み込み
Step1で配置した css・jsファイルを読み込みます。
|
1 2 3 4 |
<!-- plugin --> <link rel="stylesheet" href="css/L.Control.Pan.css" /> <script src="js/L.Control.Pan.js"></script> <!-- plugin --> |
2−3.Pancontrol の設定
L.control.pan オブジェクト を mapに追加するだけで設定完了です。
|
1 |
L.control.pan().addTo(map); |
これで、Pancontrol を使うことができます。