JavaFXで棒グラフを作成・表示する方法について記載します。
目次
1. 棒グラフを作成・表示する方法(通常)
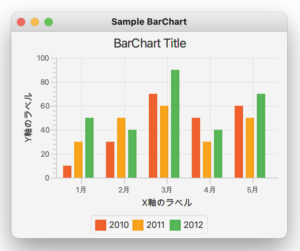
棒グラフを作成するには、BarChartクラスを使用します。
実行例
|
1 2 3 4 5 6 7 8 9 10 11 12 13 14 15 16 17 18 19 20 21 22 23 24 25 26 27 28 29 30 31 32 33 34 35 36 37 38 39 40 41 42 43 44 45 46 47 48 49 50 51 52 53 54 55 56 57 58 59 60 61 62 63 64 65 |
import javafx.application.Application; import javafx.scene.Scene; import javafx.scene.chart.BarChart; import javafx.scene.chart.CategoryAxis; import javafx.scene.chart.NumberAxis; import javafx.scene.chart.XYChart; import javafx.stage.Stage; public class SampleBarChart1 extends Application { @Override public void start(Stage pStage) { // X軸を定義 CategoryAxis xAxis = new CategoryAxis(); xAxis.setLabel("X軸のラベル"); // Y軸を定義 NumberAxis yAxis = new NumberAxis(0 ,100, 20); yAxis.setLabel("Y軸のラベル"); // 棒グラフのインスタンスを作成 BarChart<String,Number> barChart = new BarChart<>(xAxis,yAxis); barChart.setTitle("BarChart Title"); // 棒グラフにデータを登録 XYChart.Series<String,Number> series1 = new XYChart.Series<>(); series1.setName("2010"); series1.getData().add(new XYChart.Data("1月", 10)); series1.getData().add(new XYChart.Data("2月", 30)); series1.getData().add(new XYChart.Data("3月", 70)); series1.getData().add(new XYChart.Data("4月", 50)); series1.getData().add(new XYChart.Data("5月", 60)); XYChart.Series<String,Number> series2 = new XYChart.Series<>(); series2.setName("2011"); series2.getData().add(new XYChart.Data("1月", 30)); series2.getData().add(new XYChart.Data("2月", 50)); series2.getData().add(new XYChart.Data("3月", 60)); series2.getData().add(new XYChart.Data("4月", 30)); series2.getData().add(new XYChart.Data("5月", 50)); XYChart.Series<String,Number> series3 = new XYChart.Series<>(); series3.setName("2012"); series3.getData().add(new XYChart.Data("1月", 50)); series3.getData().add(new XYChart.Data("2月", 40)); series3.getData().add(new XYChart.Data("3月", 90)); series3.getData().add(new XYChart.Data("4月", 40)); series3.getData().add(new XYChart.Data("5月", 70)); // 棒グラフにデータを追加 Scene scene = new Scene(barChart,400,300); barChart.getData().addAll(series1, series2, series3); pStage.setTitle("Sample BarChart"); pStage.setScene(scene); pStage.show(); } public static void main(String[] args){ Application.launch(args); } } |
1. 軸の定義
文字データを使用する場合は、CategoryAxisクラスを使用します。(X軸)
数値データを使用する場合は、NumberAxisクラスを使用します。(Y軸)
|
1 2 3 4 5 6 7 |
// X軸を定義 CategoryAxis xAxis = new CategoryAxis(); xAxis.setLabel("X軸のラベル"); // Y軸を定義 NumberAxis yAxis = new NumberAxis(0 ,100, 20); yAxis.setLabel("Y軸のラベル"); |
2. BarChartクラスの生成
BarChartクラスのインスタンス生成時に、X・Y軸のインスタンスをコンストラクタの引数に渡します。
また、X軸は文字列、Y軸は数値なのでジェネリクスは、<String,Number> と指定しています。
|
1 |
BarChart<String,Number> barChart = new BarChart<>(xAxis,yAxis); |
3. グラフに表示するデータ
表示するデータは、系列データごとに、XYChart.Seriesクラスのインスタンスを作成して追加します。
|
1 2 |
XYChart.Series<String,Number> series1 = new XYChart.Series<>(); series1.getData().add(new XYChart.Data("1月", 10)); |
2. 棒グラフを作成・表示する方法(横棒グラフ)
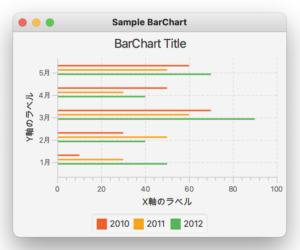
X軸に数値データ(NumberAxis)、Y軸に文字列データ(CategoryAxis)を使用すると横棒グラフを作成できます。
実行例
|
1 2 3 4 5 6 7 8 9 10 11 12 13 14 15 16 17 18 19 20 21 22 23 24 25 26 27 28 29 30 31 32 33 34 35 36 37 38 39 40 41 42 43 44 45 46 47 48 49 50 51 52 53 54 55 56 57 58 59 60 61 62 63 64 65 |
import javafx.application.Application; import javafx.scene.Scene; import javafx.scene.chart.BarChart; import javafx.scene.chart.CategoryAxis; import javafx.scene.chart.NumberAxis; import javafx.scene.chart.XYChart; import javafx.stage.Stage; public class SampleBarChart2 extends Application { @Override public void start(Stage pStage) { // X軸を定義(目盛の最小値:0、最大値:100、大目盛の間隔:20) NumberAxis xAxis = new NumberAxis(0 ,100, 20); xAxis.setLabel("X軸のラベル"); // Y軸を定義 CategoryAxis yAxis = new CategoryAxis(); yAxis.setLabel("Y軸のラベル"); // 棒グラフのインスタンスを作成 BarChart<Number,String> barChart = new BarChart<>(xAxis,yAxis); barChart.setTitle("BarChart Title"); // 棒グラフにデータを登録 XYChart.Series<Number,String> series1 = new XYChart.Series<>(); series1.setName("2010"); series1.getData().add(new XYChart.Data(10, "1月")); series1.getData().add(new XYChart.Data(30, "2月")); series1.getData().add(new XYChart.Data(70, "3月")); series1.getData().add(new XYChart.Data(50, "4月")); series1.getData().add(new XYChart.Data(60, "5月")); XYChart.Series<Number,String> series2 = new XYChart.Series<>(); series2.setName("2011"); series2.getData().add(new XYChart.Data(30, "1月")); series2.getData().add(new XYChart.Data(50, "2月")); series2.getData().add(new XYChart.Data(60, "3月")); series2.getData().add(new XYChart.Data(30, "4月")); series2.getData().add(new XYChart.Data(50, "5月")); XYChart.Series<Number,String> series3 = new XYChart.Series<>(); series3.setName("2012"); series3.getData().add(new XYChart.Data(50, "1月")); series3.getData().add(new XYChart.Data(40, "2月")); series3.getData().add(new XYChart.Data(90, "3月")); series3.getData().add(new XYChart.Data(40, "4月")); series3.getData().add(new XYChart.Data(70, "5月")); // 棒グラフにデータを追加 Scene scene = new Scene(barChart,400,300); barChart.getData().addAll(series1, series2, series3); pStage.setTitle("Sample BarChart"); pStage.setScene(scene); pStage.show(); } public static void main(String[] args){ Application.launch(args); } } |
1. 軸の定義
横棒グラフを作成するには、次のようにします。
X軸に数値データ(NumberAxis)
Y軸に文字列データ(CategoryAxis)
|
1 2 3 4 5 6 7 |
// X軸を定義(目盛の最小値:0、最大値:100、大目盛の間隔:20) NumberAxis xAxis = new NumberAxis(0 ,100, 20); xAxis.setLabel("X軸のラベル"); // Y軸を定義 CategoryAxis yAxis = new CategoryAxis(); yAxis.setLabel("Y軸のラベル"); |
2. BarChartクラスの生成
BarChartクラスのインスタンス生成時に、X・Y軸のインスタンスをコンストラクタの引数に渡します。
また、X軸は数値、Y軸は文字列なのでジェネリクスは、<Number,String> と指定しています。
|
1 |
BarChart<Number,String> barChart = new BarChart<>(xAxis,yAxis); |
3. グラフに表示するデータ
表示するデータは、系列データごとに、XYChart.Seriesクラスのインスタンスを作成して追加します。
|
1 2 |
XYChart.Series<Number,String> series1 = new XYChart.Series<>(); series1.getData().add(new XYChart.Data(10, "1月")); |
3. その他
1. バー間のスペースを指定する方法
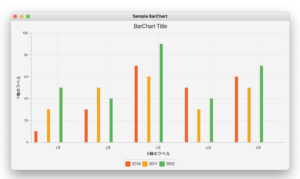
バー間のスペースを指定するには、BarChartクラスのsetBarGapメソッドを使用します。
実行例
|
1 2 |
BarChart<String,Number> barChart = new BarChart<>(xAxis,yAxis); barChart.setBarGap(30); // バー間のスペース |
2. カテゴリ間のスペースを指定する方法
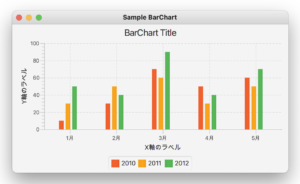
カテゴリ間のスペースを指定するには、BarChartクラスのsetCategoryGapメソッドを使用します。
実行例
|
1 2 |
BarChart<String,Number> barChart = new BarChart<>(xAxis,yAxis); barChart.setCategoryGap(50); // カテゴリ間の距離 |
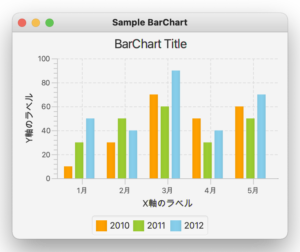
3. グラフの色を変更する方法
グラフの色を変更するには、各Seriesごとに変更後の色をCSSで指定します。
実行例
|
1 2 3 4 5 6 7 8 9 10 11 12 13 14 15 16 17 18 19 20 21 22 23 24 25 26 27 28 29 30 31 32 33 34 35 36 37 38 39 40 41 42 43 44 45 46 47 48 49 50 51 52 53 54 55 56 57 58 59 60 61 62 63 64 65 66 67 68 69 |
import javafx.application.Application; import javafx.scene.Scene; import javafx.scene.chart.BarChart; import javafx.scene.chart.CategoryAxis; import javafx.scene.chart.NumberAxis; import javafx.scene.chart.XYChart; import javafx.stage.Stage; public class SampleBarChart4 extends Application { @Override public void start(Stage pStage) { // X軸を定義 CategoryAxis xAxis = new CategoryAxis(); xAxis.setLabel("X軸のラベル"); // Y軸を定義 NumberAxis yAxis = new NumberAxis(0 ,100, 20); yAxis.setLabel("Y軸のラベル"); // 棒グラフのインスタンスを作成 BarChart<String,Number> barChart = new BarChart<>(xAxis,yAxis); barChart.setTitle("BarChart Title"); // 棒グラフにデータを登録 XYChart.Series<String,Number> series1 = new XYChart.Series<>(); series1.setName("2010"); series1.getData().add(new XYChart.Data("1月", 10)); series1.getData().add(new XYChart.Data("2月", 30)); series1.getData().add(new XYChart.Data("3月", 70)); series1.getData().add(new XYChart.Data("4月", 50)); series1.getData().add(new XYChart.Data("5月", 60)); XYChart.Series<String,Number> series2 = new XYChart.Series<>(); series2.setName("2011"); series2.getData().add(new XYChart.Data("1月", 30)); series2.getData().add(new XYChart.Data("2月", 50)); series2.getData().add(new XYChart.Data("3月", 60)); series2.getData().add(new XYChart.Data("4月", 30)); series2.getData().add(new XYChart.Data("5月", 50)); XYChart.Series<String,Number> series3 = new XYChart.Series<>(); series3.setName("2012"); series3.getData().add(new XYChart.Data("1月", 50)); series3.getData().add(new XYChart.Data("2月", 40)); series3.getData().add(new XYChart.Data("3月", 90)); series3.getData().add(new XYChart.Data("4月", 40)); series3.getData().add(new XYChart.Data("5月", 70)); // 棒グラフにデータを追加 Scene scene = new Scene(barChart,400,300); barChart.getData().addAll(series1, series2, series3); pStage.setTitle("Sample BarChart"); pStage.setScene(scene); pStage.show(); // 各データ(Series)の色を変更 barChart.lookupAll(".default-color0.chart-bar").forEach(n -> n.setStyle("-fx-bar-fill: orange;")); barChart.lookupAll(".default-color1.chart-bar").forEach(n -> n.setStyle("-fx-bar-fill: yellowgreen;")); barChart.lookupAll(".default-color2.chart-bar").forEach(n -> n.setStyle("-fx-bar-fill: skyblue;")); } public static void main(String[] args){ Application.launch(args); } } |
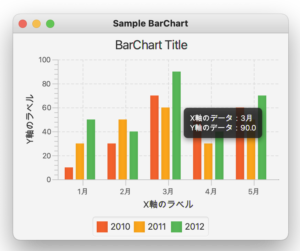
4. グラフの値をツールチップに表示する方法
グラフにマウスポインタを当てたタイミングで、ツールチップに値を表示します。
系列ごとの各データに、OnMouseEntered、 OnMouseExited イベントを登録してツールチップを表示します。
実行例
|
1 2 3 4 5 6 7 8 9 10 11 12 13 14 15 16 17 18 19 20 21 22 23 24 25 26 27 28 29 30 31 32 33 34 35 36 37 38 39 40 41 42 43 44 45 46 47 48 49 50 51 52 53 54 55 56 57 58 59 60 61 62 63 64 65 66 67 68 69 70 71 72 73 74 75 76 77 78 79 80 81 82 83 84 |
import javafx.application.Application; import javafx.scene.Scene; import javafx.scene.chart.BarChart; import javafx.scene.chart.CategoryAxis; import javafx.scene.chart.NumberAxis; import javafx.scene.chart.XYChart; import javafx.scene.control.Tooltip; import javafx.stage.Stage; public class SampleBarChart5 extends Application { @Override public void start(Stage pStage) { // X軸を定義 CategoryAxis xAxis = new CategoryAxis(); xAxis.setLabel("X軸のラベル"); // Y軸を定義 NumberAxis yAxis = new NumberAxis(0 ,100, 20); yAxis.setLabel("Y軸のラベル"); // 棒グラフのインスタンスを作成 BarChart<String,Number> barChart = new BarChart<>(xAxis,yAxis); barChart.setTitle("BarChart Title"); // 棒グラフにデータを登録 XYChart.Series<String,Number> series1 = new XYChart.Series<>(); series1.setName("2010"); series1.getData().add(new XYChart.Data("1月", 10)); series1.getData().add(new XYChart.Data("2月", 30)); series1.getData().add(new XYChart.Data("3月", 70)); series1.getData().add(new XYChart.Data("4月", 50)); series1.getData().add(new XYChart.Data("5月", 60)); XYChart.Series<String,Number> series2 = new XYChart.Series<>(); series2.setName("2011"); series2.getData().add(new XYChart.Data("1月", 30)); series2.getData().add(new XYChart.Data("2月", 50)); series2.getData().add(new XYChart.Data("3月", 60)); series2.getData().add(new XYChart.Data("4月", 30)); series2.getData().add(new XYChart.Data("5月", 50)); XYChart.Series<String,Number> series3 = new XYChart.Series<>(); series3.setName("2012"); series3.getData().add(new XYChart.Data("1月", 50)); series3.getData().add(new XYChart.Data("2月", 40)); series3.getData().add(new XYChart.Data("3月", 90)); series3.getData().add(new XYChart.Data("4月", 40)); series3.getData().add(new XYChart.Data("5月", 70)); // 棒グラフにデータを追加 Scene scene = new Scene(barChart,400,300); barChart.getData().addAll(series1, series2, series3); // ツールチップをを設定 for (XYChart.Series<String, Number> series : barChart.getData()) { // 系列のループ for (XYChart.Data<String, Number> data : series.getData()) { // 系列内の各データのループ Tooltip.install(data.getNode(), new Tooltip( "X軸のデータ:" + data.getXValue().toString() + "\n" + "Y軸のデータ:" + data.getYValue())); // ポインタが当たった時の動作 data.getNode().setOnMouseEntered( event -> data.getNode().getStyleClass().add("onHover")); // ポインタが外れた時の動作 data.getNode().setOnMouseExited( event -> data.getNode().getStyleClass().remove("onHover")); } } pStage.setTitle("Sample BarChart"); pStage.setScene(scene); pStage.show(); } public static void main(String[] args){ Application.launch(args); } } |